Drunk Driving - Worst States and Worrying Trends
UPDATED July 2026
Drunk driving is a serious problem in the United States. Did you know that around 28 people die each day because of drunk driving collisions in America, according to the National Highway Traffic and Safety Administration? Every year, that adds up to over 10,000 people who have lost their lives and thousands, or even millions, more who have to deal with the loss of those they love.
In this article, you’ll find out more about which states have the worst drunk driving issues. This data is imperative to identifying the issues so that states and their legislatures can start to take action.
US Drunk Driving Statistics
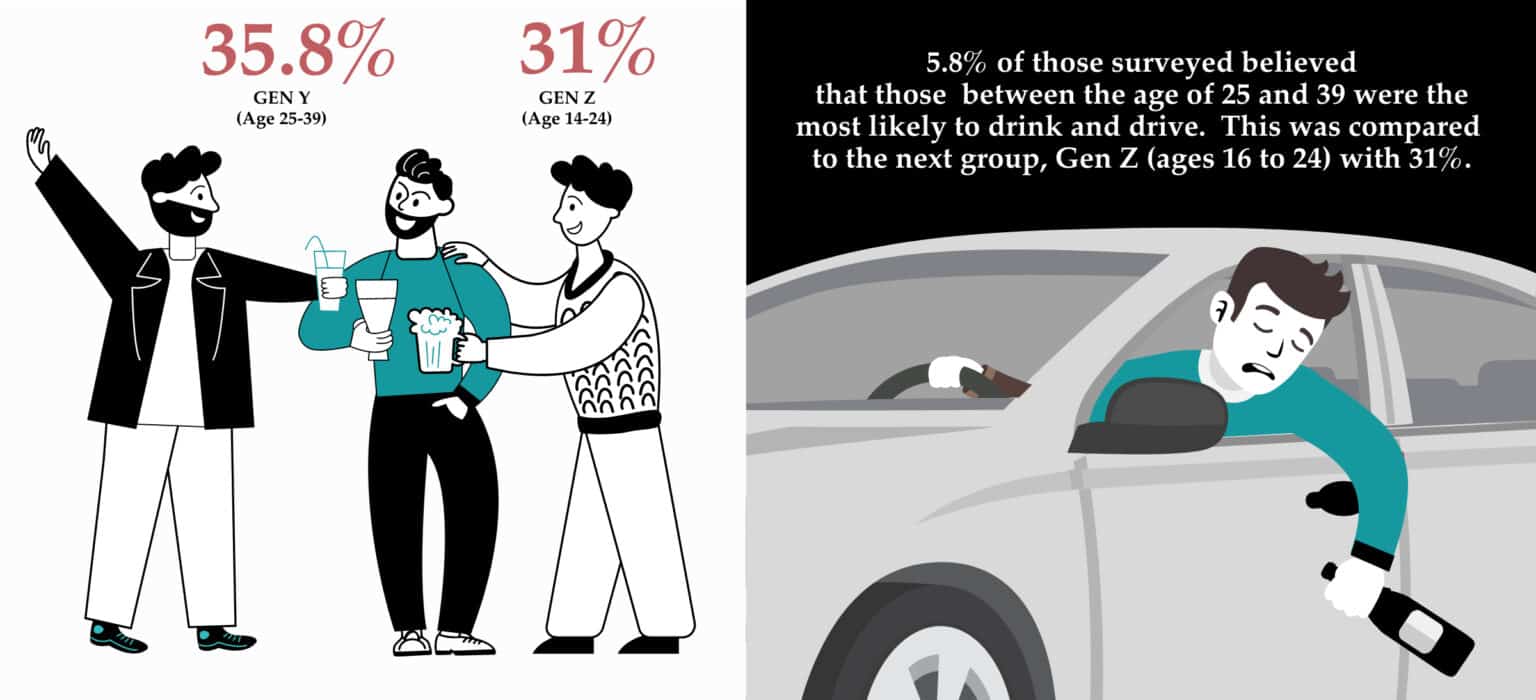
1. A survey of 1,500 Americans on a 2020 survey by The Zebra found that 35.8% of those surveyed believed that those between the age of 25 and 39 were the most likely to drink and drive. This was compared to the next group, Gen Z (ages 16 to 24) with 31%.
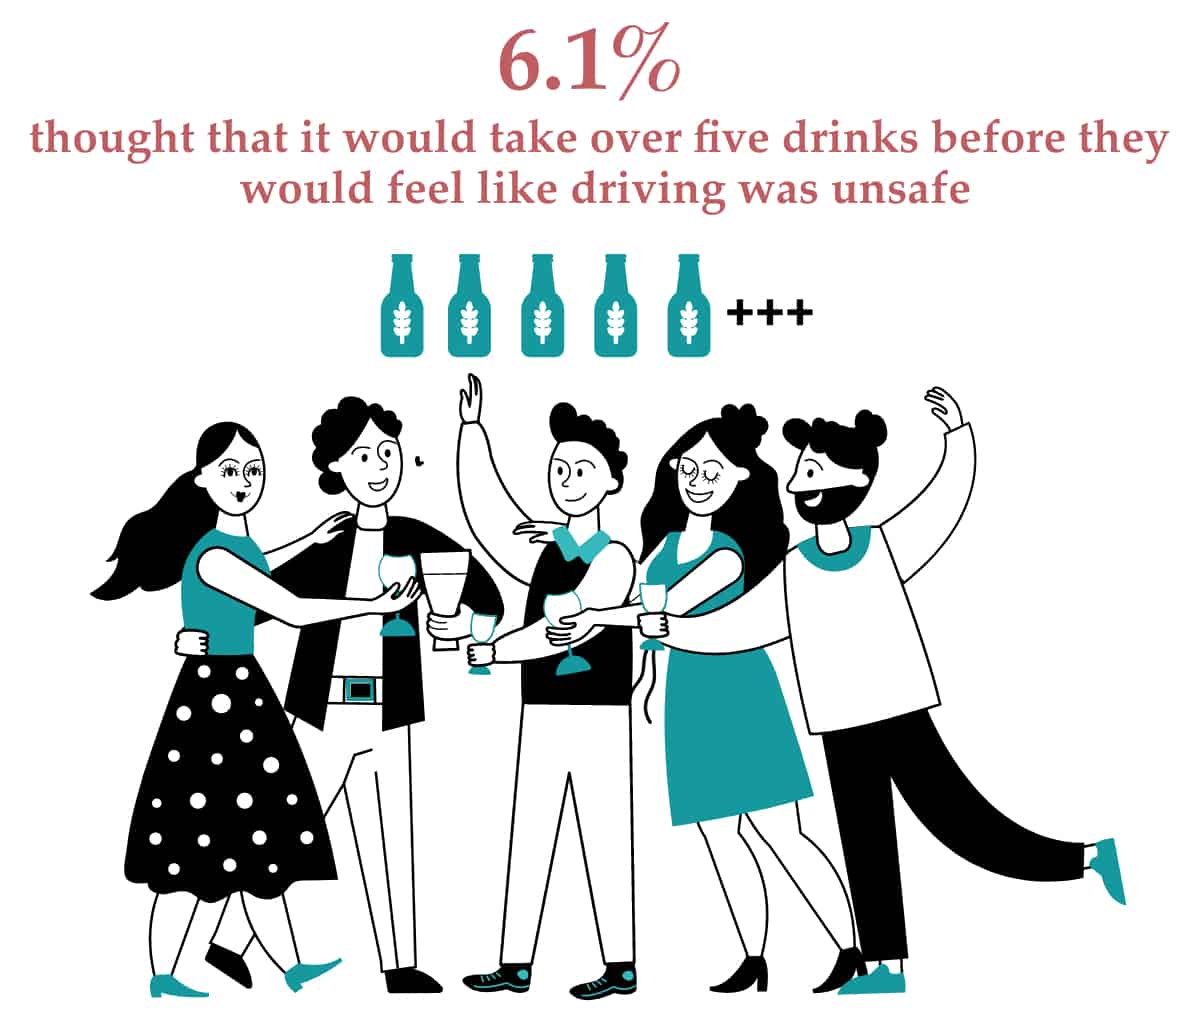
2. Over a fourth of those who responded to the 2020 survey stated that they thought they would need to have three or four alcoholic drinks before they would feel unfit to be behind the wheel. Out of those surveyed, 6.1% thought that it would take over five drinks before they would feel like driving was unsafe.
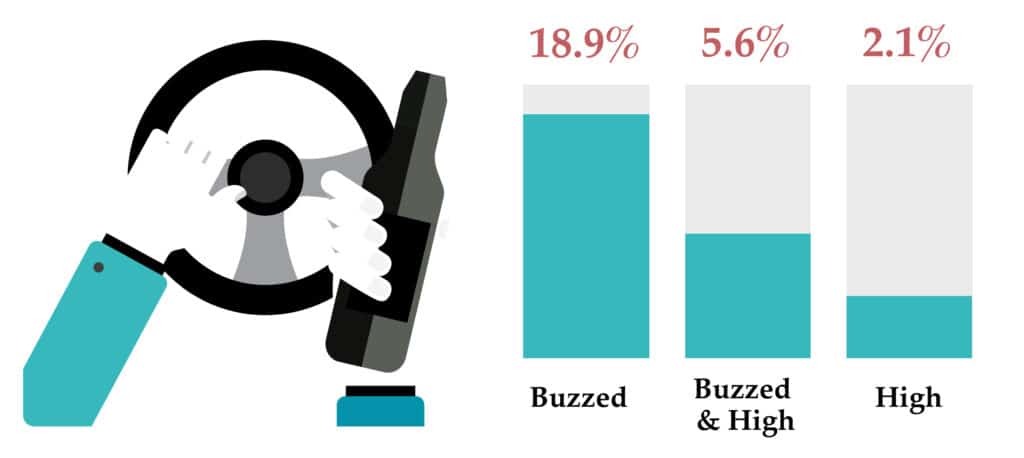
3. Respondents admitting to drinking and driving shows that drinking and driving happens fairly regularly. Out of the 1,500 polled, 18.9% admitted that they had driven while buzzed. Another 5.6% admitted to driving while buzzed and while high. Only 2.1% said that they drive while high alone.
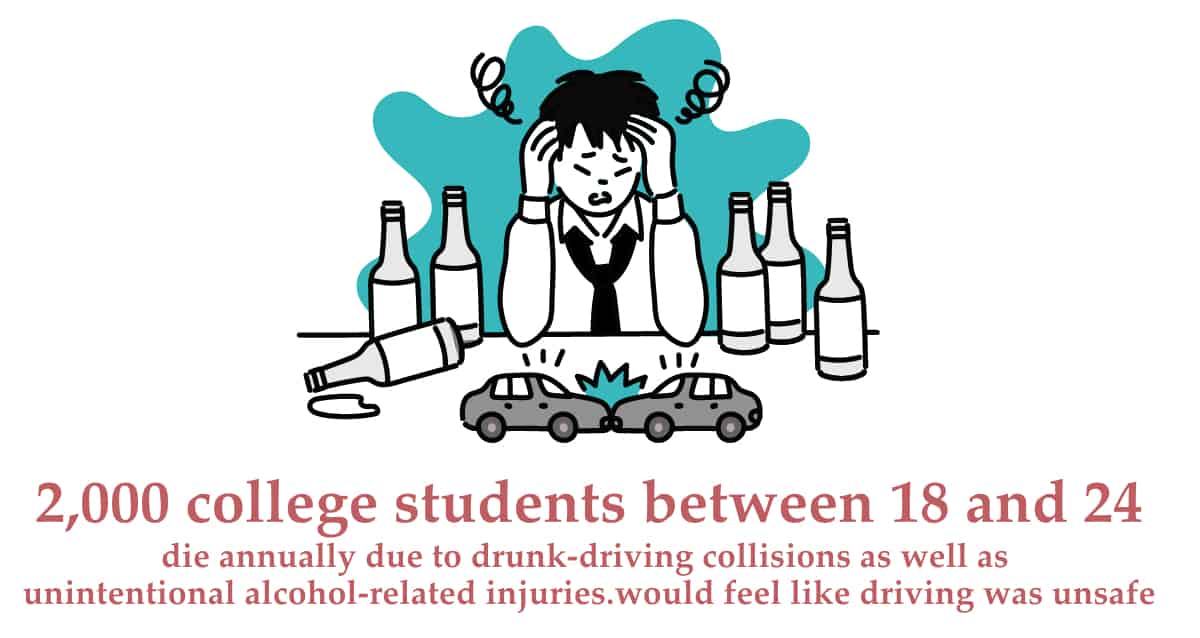
4. Drinking and driving is a leading cause of death for those under the age of 18. Around 18% of those under 21 admit to drinking and driving. Older teens and young adults are at risk, too. Mothers Against Drunk Driving states that around 2,000 college students between 18 and 24 die annually due to drunk-driving collisions as well as unintentional alcohol-related injuries.
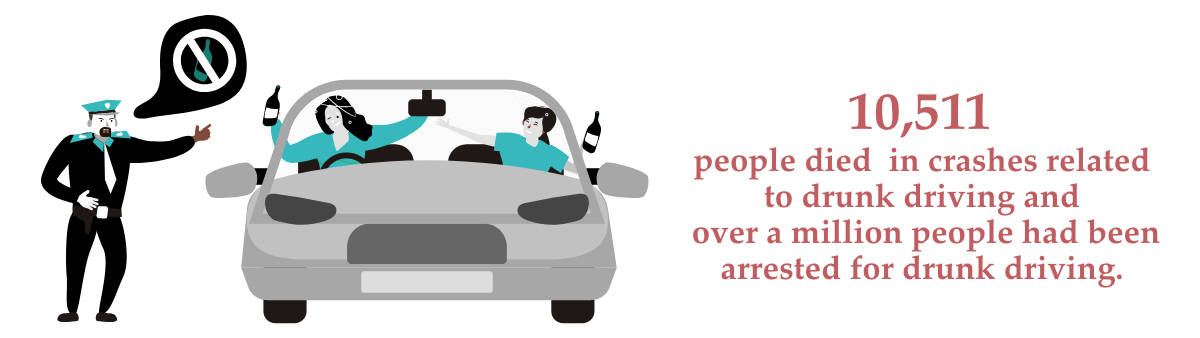
5. In 2018, the National Highway Traffic Safety Administration reported that 10,511 people died in crashes related to drunk driving. The Federal Bureau of Investigation showed that this is the tip of the iceberg when it estimated that over a million people had been arrested for drunk driving in the same year.
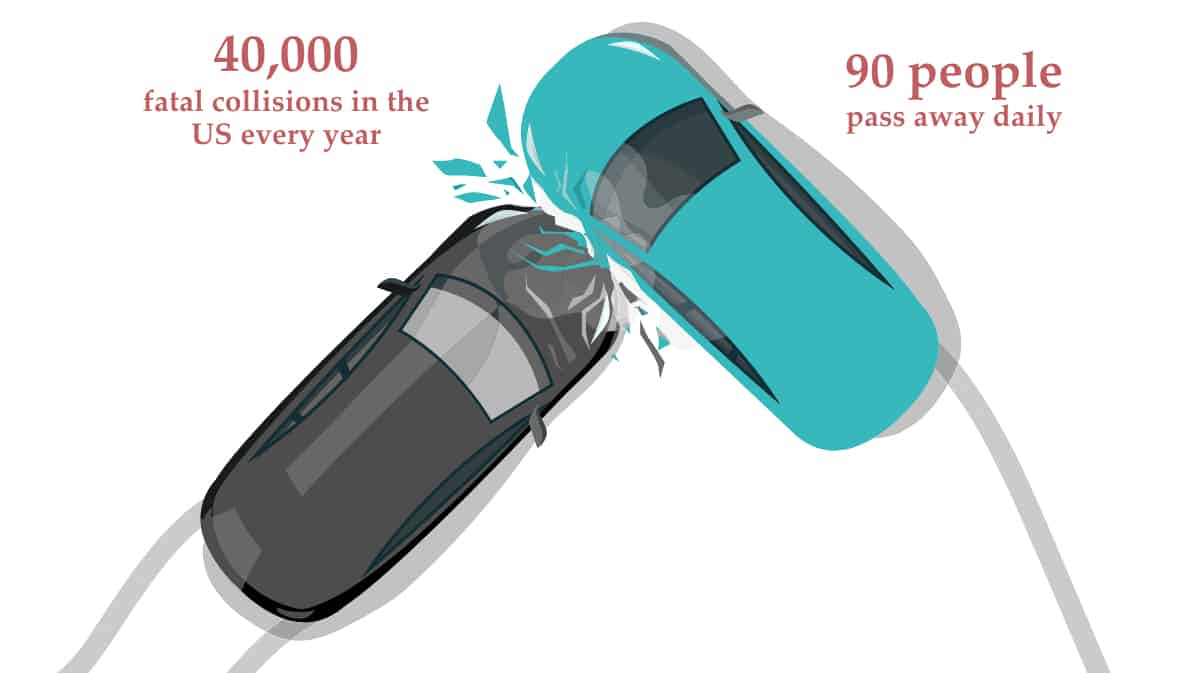
6. There are over 40,000 fatal collisions that happen in the United States every year from a multitude of causes. That means that over 90 people pass away daily as a result of crashes.
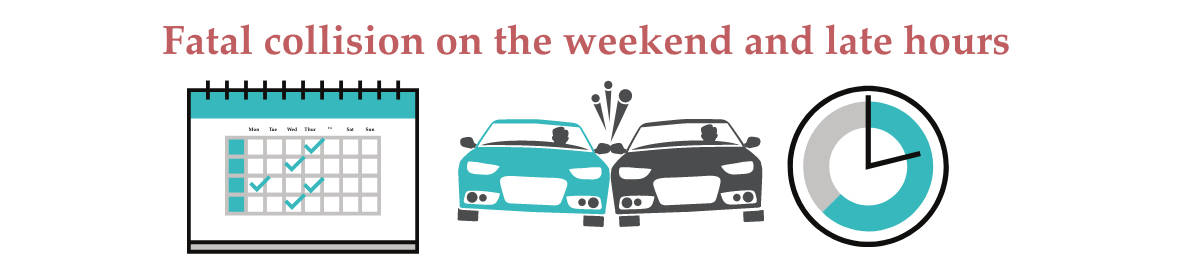
7. Want to avoid a collision? You can if you stay off the road during busy and dangerous times. It has been found that you are more likely to be involved in a fatal collision on the weekend than at any other time. Late night hours, such as after bars let out, are also riskier.
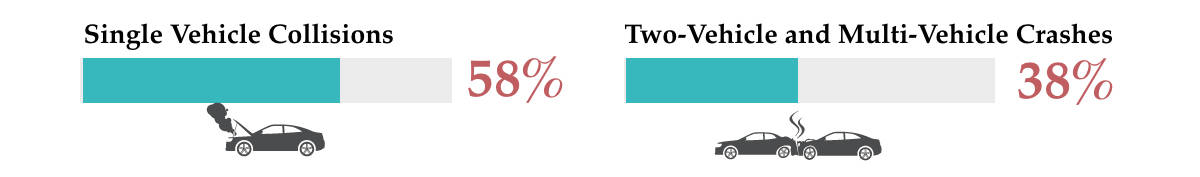
8. Many fatal drunk driving collisions only involve a single vehicle. In fact, around 58% are single-vehicle collisions. This is compared to two-vehicle and multi-vehicle crashes, which make up around another 38% of all collisions. Other kinds of collisions may include those with pedestrians, cyclists or motorcyclists.
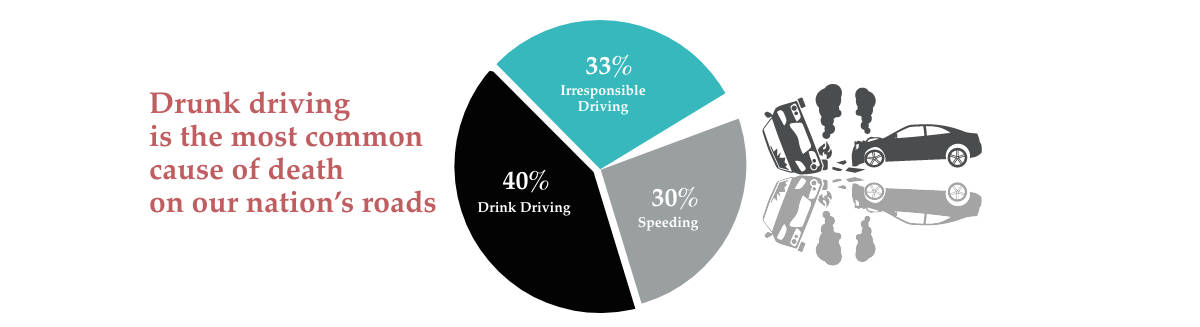
9. Drunk driving is the most common cause of death on our nation’s roads. In the United States, drunk driving causes approximately 40% of all traffic deaths. Irresponsible driving causes around 33% of crashes, while speeding causes another 30% of collisions.
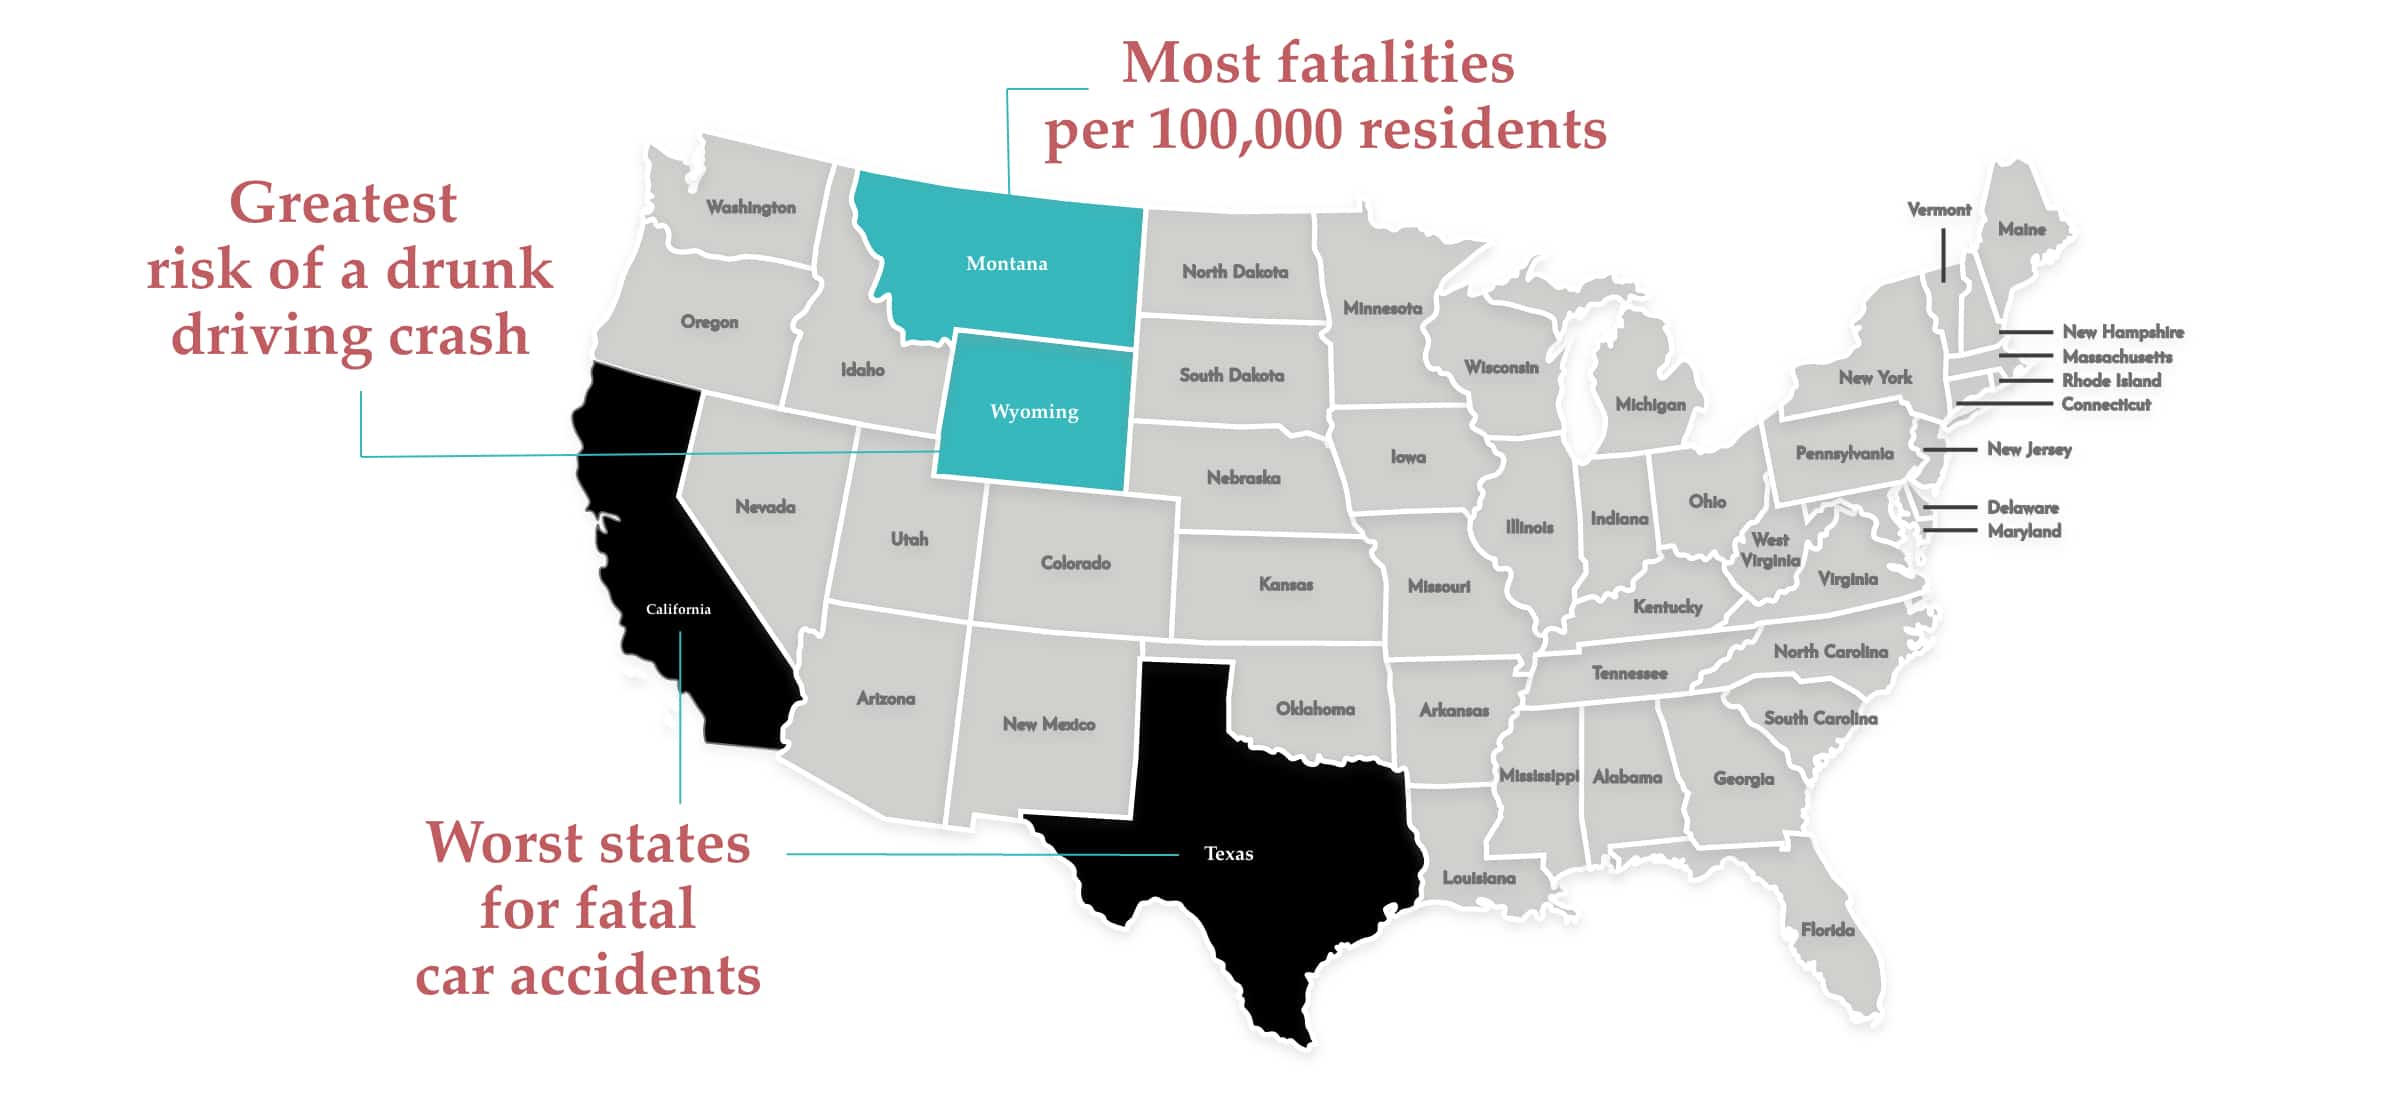
10. In 2018, Texas and California were the worst states for fatal car accidents. Interestingly, they were not at the top of the list for drunk driving collisions but instead for other issues such as distracted driving or drowsy driving. Wyoming was found to have the greatest risk of a drunk driving crash, and Montana had the most fatalities per 100,000 residents.
Which states have the biggest DUI problems?
Methodology
To find out the DUI severity score for the entire country, it was important to get the base data first. On this chart, you’ll see data collected from the FBI, National Highway Traffic Safety Administration, Centers for Disease Control and Prevention, The Zebra, Alcohol.org and Responsibility.org, which have performed studies and gathered data for the public.
The data was added to this chart reading from left to right. Then, each column’s topic data were ranked from 1 to 50 and given a point value. From there, the point values could be added together to get the state with the highest DUI severity score.
For each state’s ranking based on DUI arrests, arrest rate, DUI fatalities or total traffic deaths, you can also sort the chart by that data alone. For example, while Wyoming has the worst DUI severity score, it ranks third for the total number of traffic deaths linked to DUIs.
Table - DUI by State
| Rank | State | DUI arrests | DUI arrest rate (per 100k) | DUI fatalities | % of total traffic deaths | DUI severity score |
|---|---|---|---|---|---|---|
| 3 | Montana | 3,794 | 381.24 | 79 | 43% | 11.25 |
| 11 | Texas | 69,643 | 259.58 | 1439 | 40% | 7.52 |
| 38 | Connecticut | 7,484 | 216.44 | 115 | 39% | 5.38 |
| 9 | Alaska | 3,148 | 429.03 | 29 | 36% | 8.22 |
| 2 | South Dakota | 5,891 | 721.93 | 45 | 35% | 12.32 |
| 10 | Wisconsin | 24,368 | 425.26 | 199 | 34% | 7.68 |
| 45 | Rhode Island | 2,423 | 229.17 | 20 | 34% | 4.18 |
| 44 | New York | 25,094 | 262.18 | 307 | 33% | 4.19 |
| 50 | Massachusetts | 8,280 | 140.71 | 120 | 33% | 4.04 |
| 14 | New Hampshire | 5,053 | 383.6 | 48 | 33% | 7.37 |
| 36 | California | 127,250 | 322.71 | 1069 | 30% | 5.91 |
| 48 | Illinois | 2,825 | 98.59 | 309 | 30% | 4.19 |
| 13 | Colorado | 20,353 | 410.96 | 188 | 30% | 7.41 |
| 25 | Washington | 27,632 | 430.19 | 166 | 30% | 6.5 |
| 15 | Oregon | 13,707 | 369.46 | 153 | 30% | 7.35 |
| 12 | Maine | 5,811 | 434.17 | 42 | 30% | 7.48 |
| 30 | Hawaii | 4,288 | 373.48 | 35 | 30% | 6.2 |
| 1 | Wyoming | 3,432 | 676.1 | 34 | 30% | 12.65 |
| 7 | North Carolina | 27,915 | 518.82 | 421 | 29% | 9.24 |
| 39 | Virginia | 20,885 | 253.45 | 240 | 29% | 5.35 |
| 27 | Nebraska | 4,630 | 305.38 | 66 | 29% | 6.47 |
| 33 | Pennsylvania | 43,798 | 346.79 | 334 | 28% | 6.08 |
| 46 | Ohio | 13,723 | 152.28 | 294 | 28% | 4.04 |
| 8 | South Carolina | 15,188 | 344.48 | 291 | 28% | 9.17 |
| 20 | Arizona | 19,200 | 291.52 | 285 | 28% | 6.89 |
| 34 | Louisiana | 5,650 | 142.88 | 216 | 28% | 6.06 |
| 6 | New Mexico | 6,464 | 459.67 | 108 | 28% | 9.75 |
| 37 | Minnesota | 20,186 | 362.35 | 105 | 28% | 5.49 |
| 41 | Michigan | 26,130 | 265.07 | 267 | 27% | 5.32 |
| 28 | Iowa | 10,082 | 375.23 | 85 | 27% | 6.45 |
| 4 | North Dakota | 5,136 | 678.35 | 29 | 27% | 10.6 |
| 40 | Florida | 32,127 | 150.98 | 814 | 26% | 5.33 |
| 17 | Alabama | 6,391 | 208.12 | 246 | 26% | 7.11 |
| 32 | Missouri | 11,874 | 219.61 | 240 | 26% | 6.11 |
| 29 | Indiana | 11,890 | 295.37 | 227 | 26% | 6.35 |
| 21 | Arkansas | 5,761 | 218.21 | 134 | 26% | 6.63 |
| 24 | Nevada | 10,984 | 364.51 | 87 | 26% | 6.51 |
| 18 | Georgia | 23,449 | 347.79 | 375 | 25% | 7.04 |
| 5 | Mississippi | 5,370 | 462.21 | 163 | 25% | 10.08 |
| 19 | Idaho | 5,689 | 365.86 | 58 | 25% | 6.96 |
| 49 | Delaware | 427 | 44.29 | 28 | 25% | 4.18 |
| 42 | Maryland | 18,150 | 308.71 | 122 | 24% | 5.11 |
| 22 | Tennessee | 19,108 | 300.28 | 243 | 23% | 6.59 |
| 43 | Utah | 7,119 | 266.53 | 61 | 23% | 4.6 |
| 23 | Vermont | 2,576 | 418.37 | 15 | 23% | 6.58 |
| 35 | Oklahoma | 8,660 | 225.07 | 145 | 22% | 5.93 |
| 47 | New Jersey | 17,230 | 219.64 | 125 | 22% | 4.6 |
| 26 | Kansas | 4,552 | 347.94 | 88 | 22% | 6.5 |
| 16 | Kentucky | 14,812 | 423.13 | 137 | 19% | 7.3 |
| 31 | West Virginia | 3,141 | 298.54 | 57 | 19% | 6.14 |
Analysis
The data above shows a few important factors. To start with, each state has already been ranked from the state with the most severe DUI issues to those with the least. Moving across the state information, the chart shows the total number of DUI arrests per state and how that converts into the DUI arrest rate per 100,000 people living in the state. Also on this chart is the overall DUI fatality rate, which states the specific number of people who lost their lives to DUIs in the year 2018. That rate has also been converted in the next column to show the overall percentage of traffic deaths linked to drunk driving.
Finally, the DUI death rate per 100,000 people was added with the other information to determine the states’ overall DUI severity scores.
DUI severity scores reflect how bad each states’ DUI issues are, but they don’t necessarily mean that the state at the top has had the most DUI arrests or the most deaths. Instead, each of the categories was ranked from 1 to 50, and then the points were added together to get the overall score. As you can see from the chart, the state found to have the fewest DUI-related issues was Massachusetts in 2018. Wyoming had the highest DUI severity score.
Worst state for drunk driving arrests: South Dakota
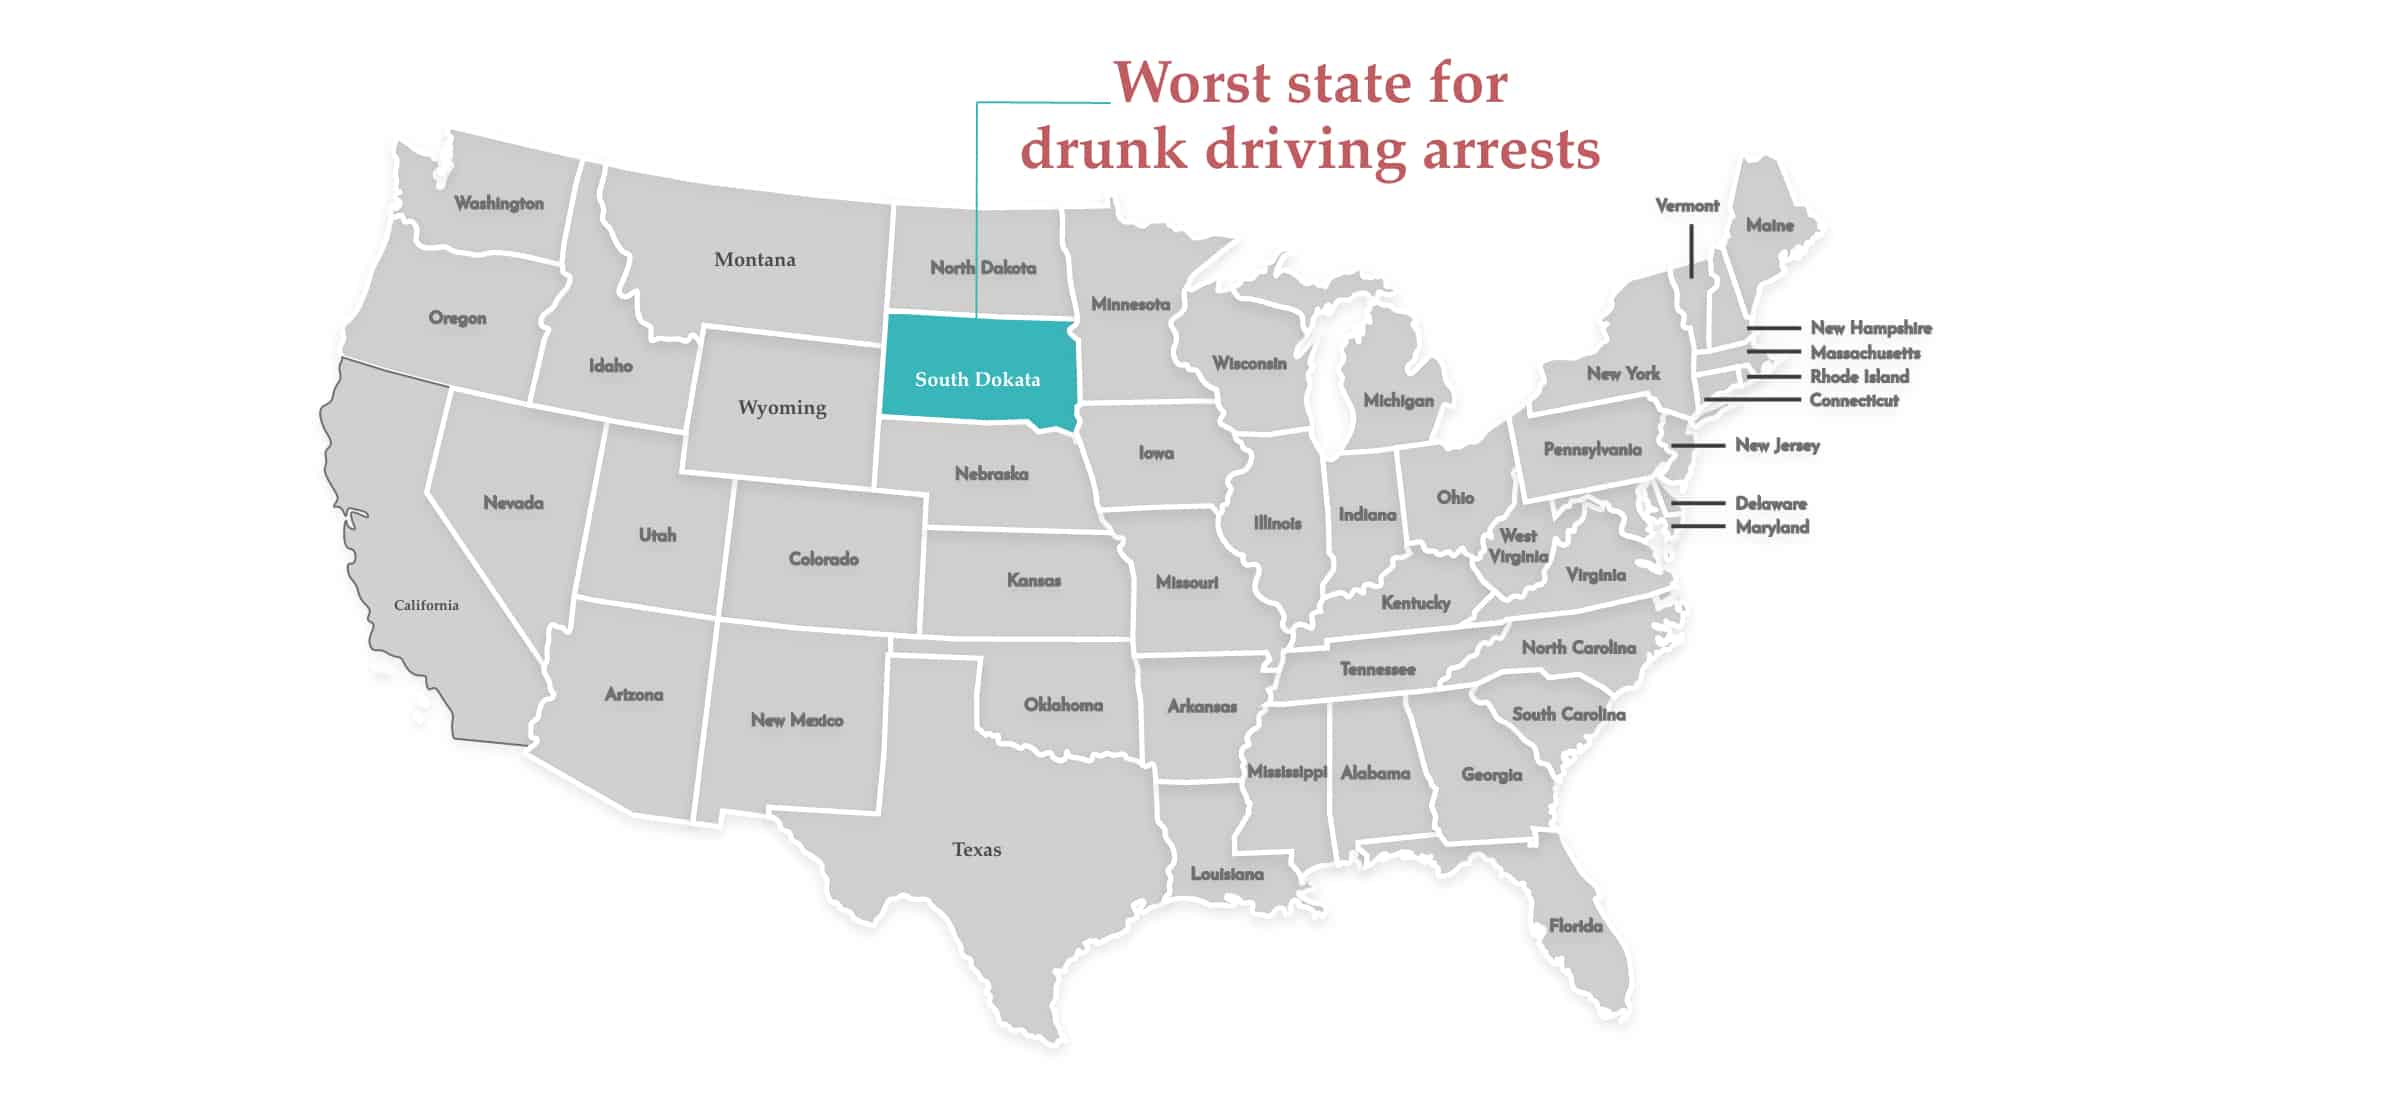
South Dakota was the worst state for DUI arrests based on the arrest rate per 100,000 people. In South Dakota, 721.93 people were arrested per 100,000 for drunk driving in 2018. The state’s traffic deaths were largely attributed to drunk driving at 35%.
Worst state for DUI fatalities: Montana
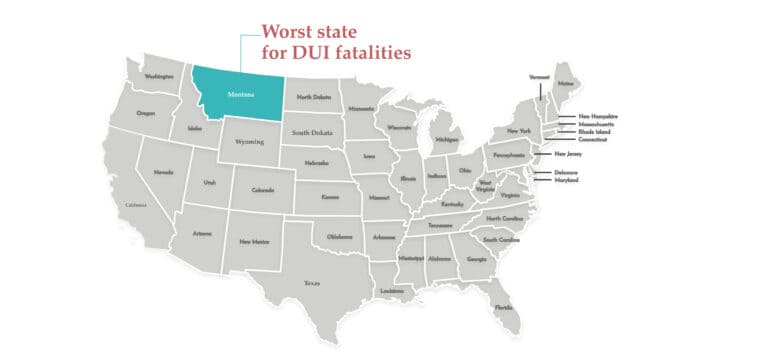
When you rank the states based on the total number of DUI fatalities per 100,000 people, you will find that around 43% of all traffic deaths were linked to drunk driving in Montana. This is the greatest percentage out of all the states with only Texas coming close at 40%.
Sources:
https://www.fbi.gov/services/cjis/ucr/
https://crashstats.nhtsa.dot.gov/#!/
https://www.cdc.gov/transportationsafety/impaired_driving/impaired-drv_factsheet.html
https://www.responsibility.org/alcohol-statistics/state-map/
https://carsurance.net/blog/car-accident-statistics/
https://www.thezebra.com/resources/research/drunk-driving-statistics/
https://alcohol.org/guides/dui-arrests-fatalities-across-us/
Additional reading:
Quickly and Easily Search Almost Anyone's:

Copyright © 2026 OurPublicRecords.org All Rights Reserved
Disclaimer: We rank sites based on our knowledge and experience. Our team visits each site and evaluates each one before placing it online. Though we do accept referrals, we guarantee that the information we share is accurate and that we will only pass on information that we think is helpful to our visitors. The referral fees that we receive go to paying our team and keeping our website operational.
OurPublicRecord.Org is a privately owned and operated website and is NOT affiliated with the US Government or any law enforcement agency.